Please check the frequently asked questions below and contact me if your question isn't covered or if you'd like to send feedback.
Weather • Locations • Data Providers • Subscriptions • Widgets • Shortcuts
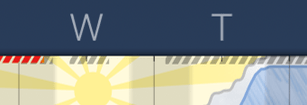
Probability of sun, clouds, rain, and snow
The amount of space taken up by each weather type represents how likely each is to occur.
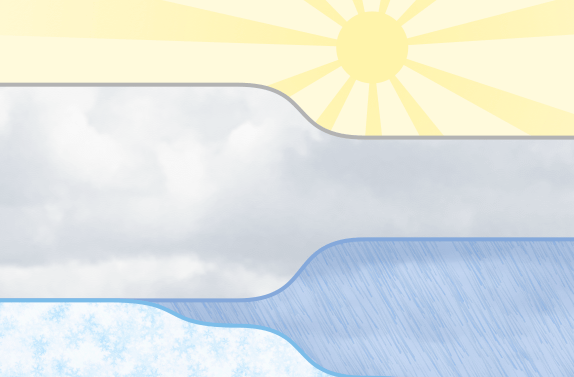
At the left end of the example here, you would expect to see direct sun (top) about 20% of the time, clouds with no precipitation (middle) about 60% of the time, and snow falling (bottom) about 20% of the time. As you move towards the right, you would expect a little more sun and a transition from snow to rain (if any precipitation falls at all).
The distance from the cloud line to the baseline of the graph represents the predicted cloud cover percentage. In the unusual case that the chance of rain is higher than the cloud coverage, it means storms are moving through the area quickly enough that the probability of rain falling over the course of an hour is more than the percentage of sky actually covered by clouds.
Remember, probabilities like these are designed to be accurate over the long term. For example, if the forecast shows a 50% chance of rain, it might rain that whole time or it might not rain at all — or anywhere in between — but over many time periods with that forecast, on average you can expect rain 50% of the time.
Amount of rain and snow
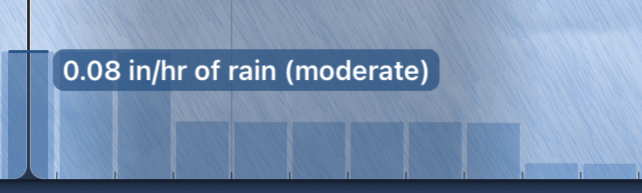
The exact number of inches (or mm) expected per hour is shown in the legend.
If the expected precipitation is snow, the bars represent the equivalent amount of meltwater, so you can compare precipitation across rain-snow transitions.
Meanwhile, the legend label shows the expected snow accumulation in inches (or cm).
Slushy snow is much denser than powdery snow, so forecasted snow amounts and meltwater amounts don't always move in lock-step. For example, as the snow transitions from slushy to powdery, the rate of snow accumulation could increase even as the meltwater equivalent decreases.
Minute-by-minute rain and snow
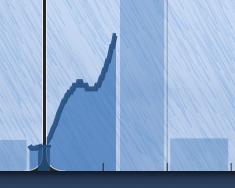
This forecast is also summarized as text above the timeline. For example: "Light rain in 18 minutes".
Unlike the hourly forecast, the minute-by-minute forecast is derived from real-time radar data. This means that the two forecast methods don't necessarily agree with each other. If the minute-by-minute forecast predicts no precipitation, the app displays "No rain for the hour" even if the longer-term forecast shows a significant chance of rain.
You can change the data source for these short term forecasts by going to the app settings screen > Forecast provider > Next-hour rain & snow.
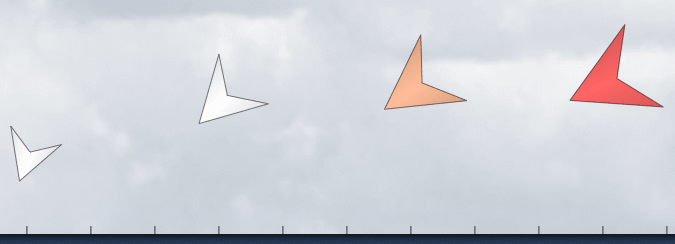
Wind indicators
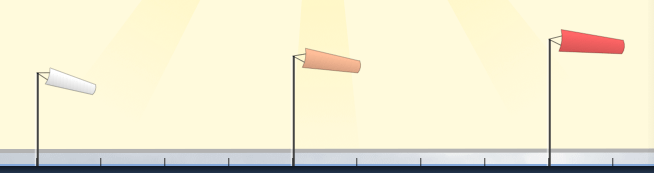
On lock screen widgets where space is most limited, windsocks are shown when gusts are above 45 mph (72 km/h).
They also appear at regular intervals on all widget types.
Options available in the app settings screen:
The size of the arrow and its height above the baseline are both roughly proportional to the wind speed.
Colors used for all wind graphics:
Choose your wind speed unit (mph, km/h, m/s, knots, or Beaufort scale) in the app settings screen > Units > Wind speed.
Display both the sustained and gust speed as a range (“4 - 9 mph”) by tapping the wind readout in the upper right and selecting "Wind & gust".
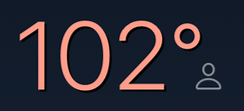
“Feels Like” temperature

“Feels Like” estimates the effects of humidity, wind, and direct sun on human skin and clothing. It is shown as a shaded area above or below the standard temperature line.
If the difference from the regular air temperature is at least 3 degrees Fahrenheit (~1.5 °C), then the “feels like” temperature is shown in the legend.
You can optionally customize the “feels like” calculation to match your exposure outdoors. To see all of the options, go to the app settings screen > “Feels Like”.
Humidity and Dew Point
Tap the middle readout at the top of the screen to view metrics related to humidity.

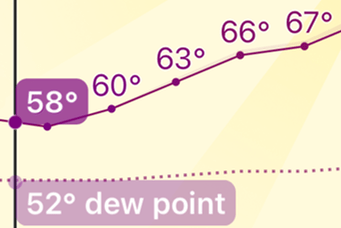
When the dew point approaches the air temperature, the relative humidity approaches 100%, and dew or precipitation is likely to form.
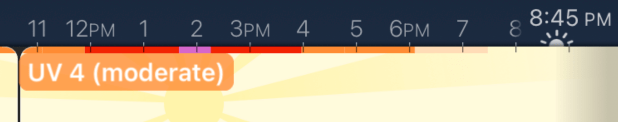
UV Index
UV indices measure the amount of harmful ultraviolet radiation from the sun that is expected to reach the earth's surface. The US EPA has an overview of how to interpret UV Index levels from low (1) to extreme (11+).
Severe weather warnings
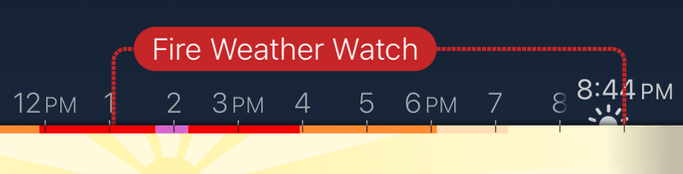
Tap the warning to see full details; then tap anywhere to dismiss the detail panel.
Air quality
The Air Quality Index (AQI) measures the concentration of air pollutants (such as smoke and smog) that can cause health issues. The US EPA has more information on how to interpret air quality metrics.
Tap the air quality readout to see more details and to view a map with all nearby monitoring stations. Air quality accuracy depends on how close the monitoring stations are to you, relative to sources of pollution such as wildfires, highways, and factories.
Weather Strip's settings screen includes an option to show the air quality description ("Good", "Moderate", "Unhealthy", etc.); the raw AQI number (0 – 500); or to not show any air quality information at all.
Data sources:
Rainbows
Weather Strip displays a rainbow across any time period where our proprietary algorithm determines there is a reasonably high chance that rainbows may be visible in the sky. 🌈
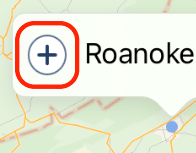
Choose forecast locations


Long-press anywhere on the map to

Save locations for easier switching
In most cases, locations are saved automatically when you view a forecast.
Forecast providers
Forecast update frequency
Weather Strip uses the most recent available forecast to predict the current weather conditions and the full week ahead. The app checks regularly for updates.
The current forecast age is displayed in the lower left corner (or a "✓" when the forecast is less than 5 hours old). Tap the label to see the full details and loading status.
The age of your forecast depends on when it was last updated by the provider. Foreca and Apple Weather update forecasts at least once per hour. In the US, NOAA usually issues new forecasts every 3 to 12 hours, depending on location and weather variability.
Family sharing
If you have a Family Premium subscription, use Apple's "family sharing" feature to manage access. If you don't have a family set up yet, follow Apple's instructions for setting up Family Sharing.
To access the subscription on a device in your family, open Weather Strip on that device and go to app settings (gear button in the lower-right of the main screen). Tap "Subscription", then tap the "Restore Purchases" link.
For this to work, the device must be signed in to an Apple Account that is part of your Apple Family Sharing group. (You can see the Apple Account at the top of the system Settings app.)
Using subscriptions from multiple devices
To access a purchase or upgrade you made on a different device, open Weather Strip on your new device and go to app settings (gear button in the lower-right of the main screen). Tap "Subscription", then tap the "Restore Purchases" link.
Make sure that the device is signed in to the same Apple Account you made the purchase with. (You can see the Apple Account at the top of the system Settings app.)
Changing your subscription
You can change your subscription at any time from app settings (tap the button in the lower-right of the main screen, then tap "Subscription").
If you upgrade to a higher-priced subscription, it will start immediately and you will get a refund for any remaining time on your previous subscription. If you downgrade, it will take effect when your previous subscription expires.
Cancellations and Refunds
All purchases are managed by Apple. To stop your subscription from auto-renewing in the future, follow Apple's instructions for cancelling your subscription. If you regret your purchase and want to lose access to your subscription immediately, follow Apple's instructions for requesting a refund.
Subscription troubleshooting
If you purchased a subscription but it is not shown on the subscription screen, or you see a subscription-related error when you load a forecast, first try restarting your device to unblock the app store purchasing system.
Then, if necessary, open Weather Strip again and go to app settings (gear button in the lower-right of the main screen). Tap "Subscription", then tap the "Restore Purchases" link.
Widget basics
See Apple's guide for adding and editing widgets. Weather Strip includes many widget styles that you can use on the Home Screen, Lock Screen, Today view, StandBy, and macOS desktop.
Be aware that adding widgets to a home screen changes its layout and takes time to undo. It's helpful to experiment first on an empty home screen page.
Widget troubleshooting
If a widget is blank or not updating consistently, try restarting your device to unblock the system. This fixes most widget problems.
Widget "Location not found"
If the widget displays a message starting with "Location not found", it means that the widget's configured forecast location is no longer in the list of saved locations in the main app. To fix this, follow the steps below to change the widget's forecast location. (Select "My current location" to avoid this error in the future.)
Widget forecast location
To change the geographic location for a widget's forecasts, you'll need to edit the widget.
Show/hide the legend
Tap the left side of the main timeline (where the legends appear) to switch between expanded and minimized legends.
Quickly return to "now"
To quickly scroll back to the beginning of the forecast (representing the present moment in time), you can:
Reloading the forecast
Weather Strip automatically reloads the forecast any time an updated forecast is expected. If an error occurs (such as no internet connection), you can manually reload the forecast by tapping the "!" in the lower left corner and then tapping "Reload".
Notifications
Weather Strip itself doesn't push any notifications, but Siri might suggest the app to you if you use it regularly. See Apple's guide for configuring Siri suggestions.
Sign up to be notified about significant updates (you can unsubscribe at any time):
Connect on Twitter: @WeatherStripApp or @RobinStewart
Connect on Mastodon: @rstew@masto.ai
Email the developer:
I welcome your feedback and read all correspondence, but I don't always have time to respond individually.
 The arrow points towards where the wind is going. This is the method used by many modern apps.
 The arrow points towards where the wind is coming from. This is the traditional method that matches the wind name ("NW", "ENE"). It's like a wind vane or glider that points into the oncoming wind.